
To add a chart to the Dashboard component, click on the New icon ( ). Once clicked a popup will appear.
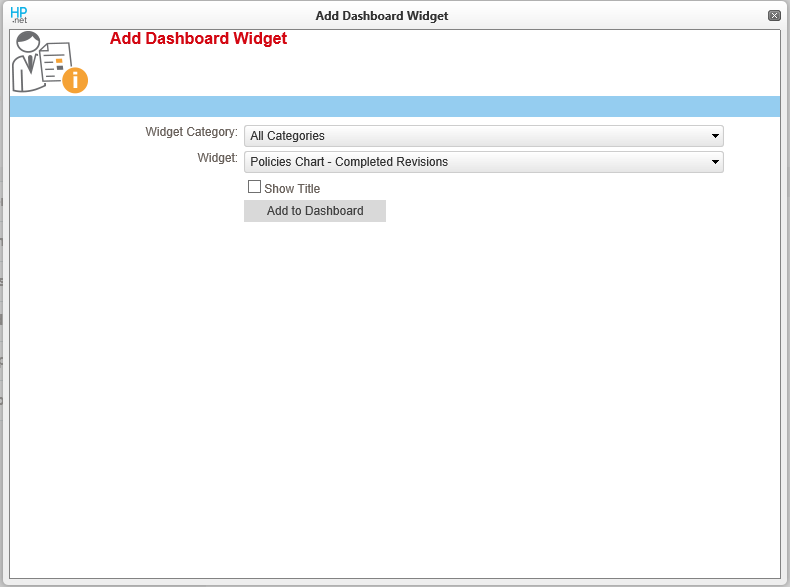
In the Widget Category dropdown, you can select the types of charts that you want to see in the Widget dropdown. This can be left blank to not filter the Widget dropdown. In the Widget dropdown, select the chart that corresponds with the information that you want represented in the Dashboard Widget.
Select the checkbox, Show Title, show text that explains what the chart is displaying.
Click on Add to Dashboard to save your changes and see the cart.
To reorder or sort the dashboard charts, click and drag the title of the chart. Drag the chart so that your curser is where you want the chart to be placed. Then release your mouse button.
Last modified:
Jul 10, 2023
Post your comment on this topic.